Visualize a cluster analysis
plot_clusters(
  features,
  clusters,
  within_connection = FALSE,
  between_connection = FALSE,
  illustrate_variance = FALSE,
  show_axes = FALSE,
  xlab = NULL,
  ylab = NULL,
  xlim = NULL,
  ylim = NULL,
  main = "",
  cex = 1.2,
  cex.axis = 1.2,
  cex.lab = 1.2,
  lwd = 1.5,
  lty = 2,
  frame.plot = FALSE,
  cex_centroid = 2
)
Arguments
- features
A data.frame or matrix representing the features that are plotted. Must have two columns.
- clusters
A vector representing the clustering
- within_connection
Boolean. Connect the elements within each clusters through lines? Useful to illustrate a graph structure.
- between_connection
Boolean. Connect the elements between each clusters through lines? Useful to illustrate a graph structure. (This argument only works for two clusters).
- illustrate_variance
Boolean. Illustrate the variance criterion in the plot?
- show_axes
Boolean, display values on the x and y-axis? Defaults to `FALSE`.
- xlab
The label for the x-axis
- ylab
The label for the y-axis
- xlim
The limits for the x-axis
- ylim
The limits for the y-axis
- main
The title of the plot
- cex
The size of the plotting symbols, see
par- cex.axis
The size of the values on the axes
- cex.lab
The size of the labels of the axes
- lwd
The width of the lines connecting elements.
- lty
The line type of the lines connecting elements (see
par).- frame.plot
a logical indicating whether a box should be drawn around the plot.
- cex_centroid
The size of the cluster center symbol (has an effect only if
illustrate_varianceisTRUE)
Details
In most cases, the argument clusters is a vector
returned by one of the functions anticlustering,
balanced_clustering or matching.
However, the plotting function can also be used to plot the results
of other cluster functions such as kmeans. This function
is usually just used to get a fast impression of the results of an
(anti)clustering assignment, but limited in its functionality.
It is useful for depicting the intra-cluster connections using
argument within_connection.
Examples
N <- 15
features <- matrix(runif(N * 2), ncol = 2)
K <- 3
clusters <- balanced_clustering(features, K = K)
anticlusters <- anticlustering(features, K = K)
user_par <- par("mfrow")
par(mfrow = c(1, 2))
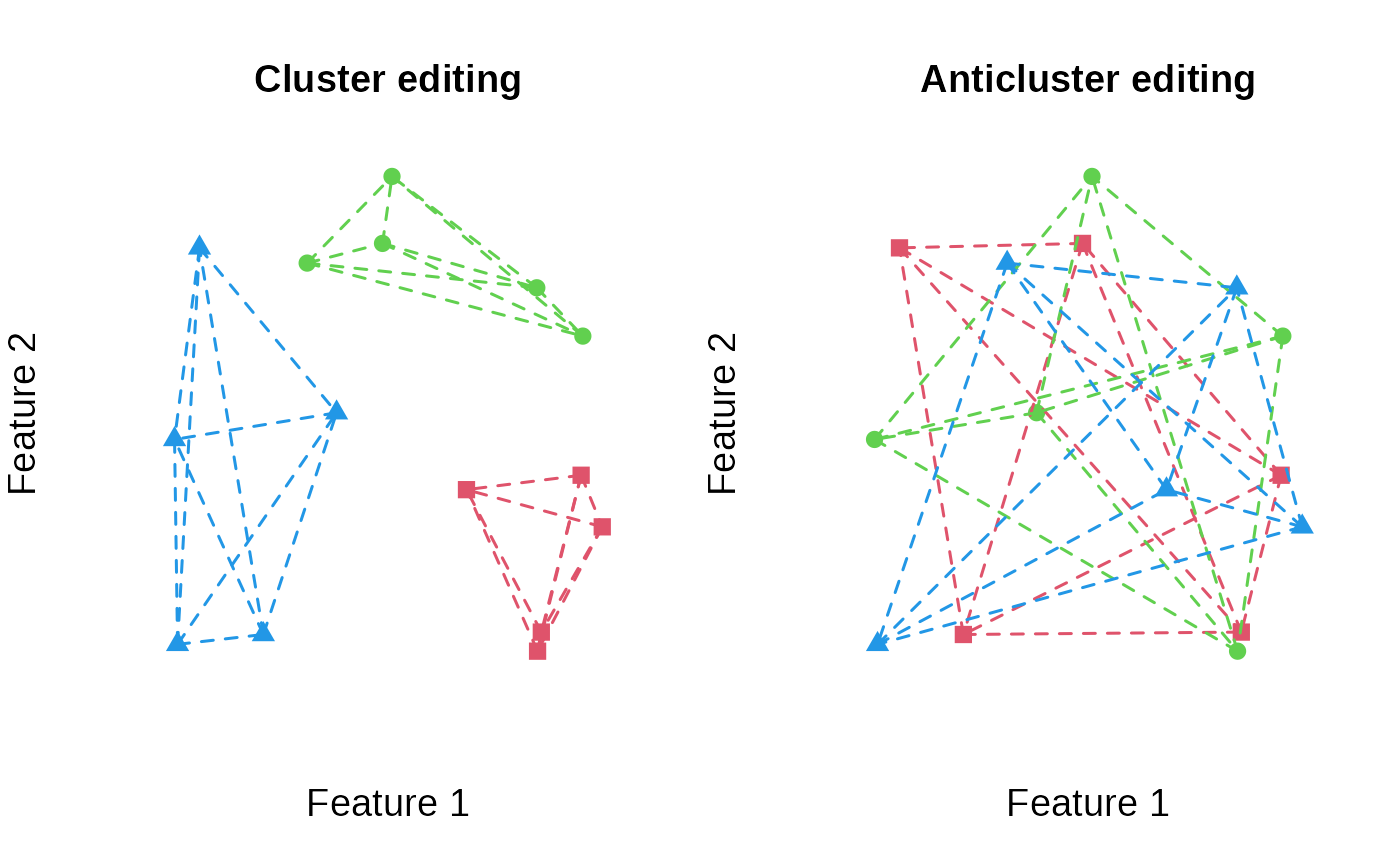
plot_clusters(features, clusters, main = "Cluster editing", within_connection = TRUE)
plot_clusters(features, anticlusters, main = "Anticluster editing", within_connection = TRUE)
 par(mfrow = user_par)