Optimally solves weighted cluster editing (also known as »correlation clustering« or »clique partitioning problem«).
wce(x, solver = NULL)Arguments
Value
An integer vector representing the cluster affiliation of each data point
Details
Finds the clustering that maximizes the sum of pairwise similarities within clusters.
In the input some similarities should be negative (indicating dissimilarity) because
otherwise the maximum sum of similarities is obtained by simply joining all elements
within a single big cluster. The function uses a "solver" to optimize
the clustering objective. See optimal_anticlustering
for an overview of the solvers that are available.
References
Bansal, N., Blum, A., & Chawla, S. (2004). Correlation clustering. Machine Learning, 56, 89–113.
Böcker, S., & Baumbach, J. (2013). Cluster editing. In Conference on Computability in Europe (pp. 33–44).
Grötschel, M., & Wakabayashi, Y. (1989). A cutting plane algorithm for a clustering problem. Mathematical Programming, 45, 59-96.
Wittkop, T., Emig, D., Lange, S., Rahmann, S., Albrecht, M., Morris, J. H., ..., Baumbach, J. (2010). Partitioning biological data with transitivity clustering. Nature Methods, 7, 419–420.
Examples
# \donttest{
features <- swiss
distances <- dist(scale(swiss))
hist(distances)
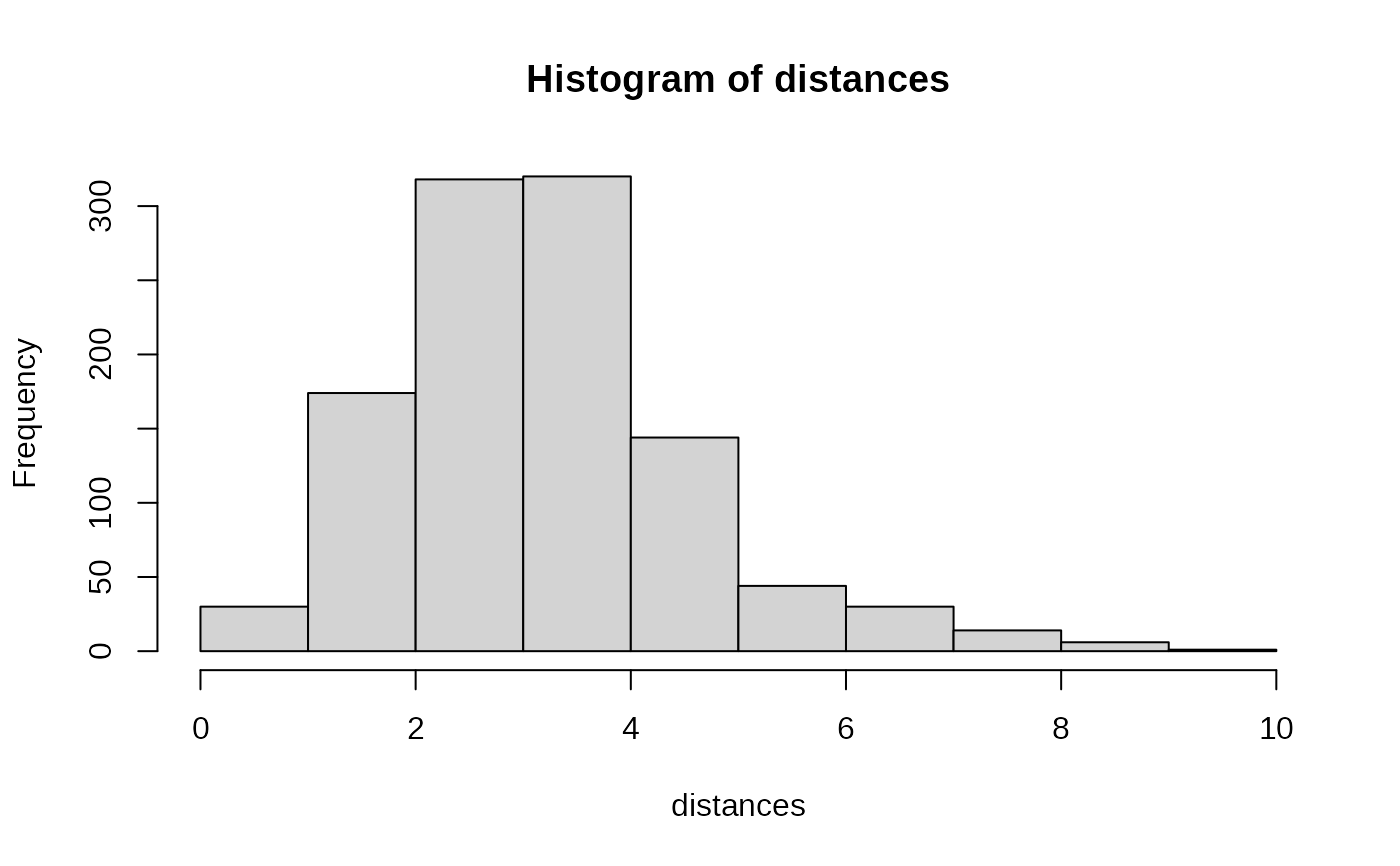 # Define agreement as being close enough to each other.
# By defining low agreement as -1 and high agreement as +1, we
# solve *unweighted* cluster editing
agreements <- ifelse(as.matrix(distances) < 3, 1, -1)
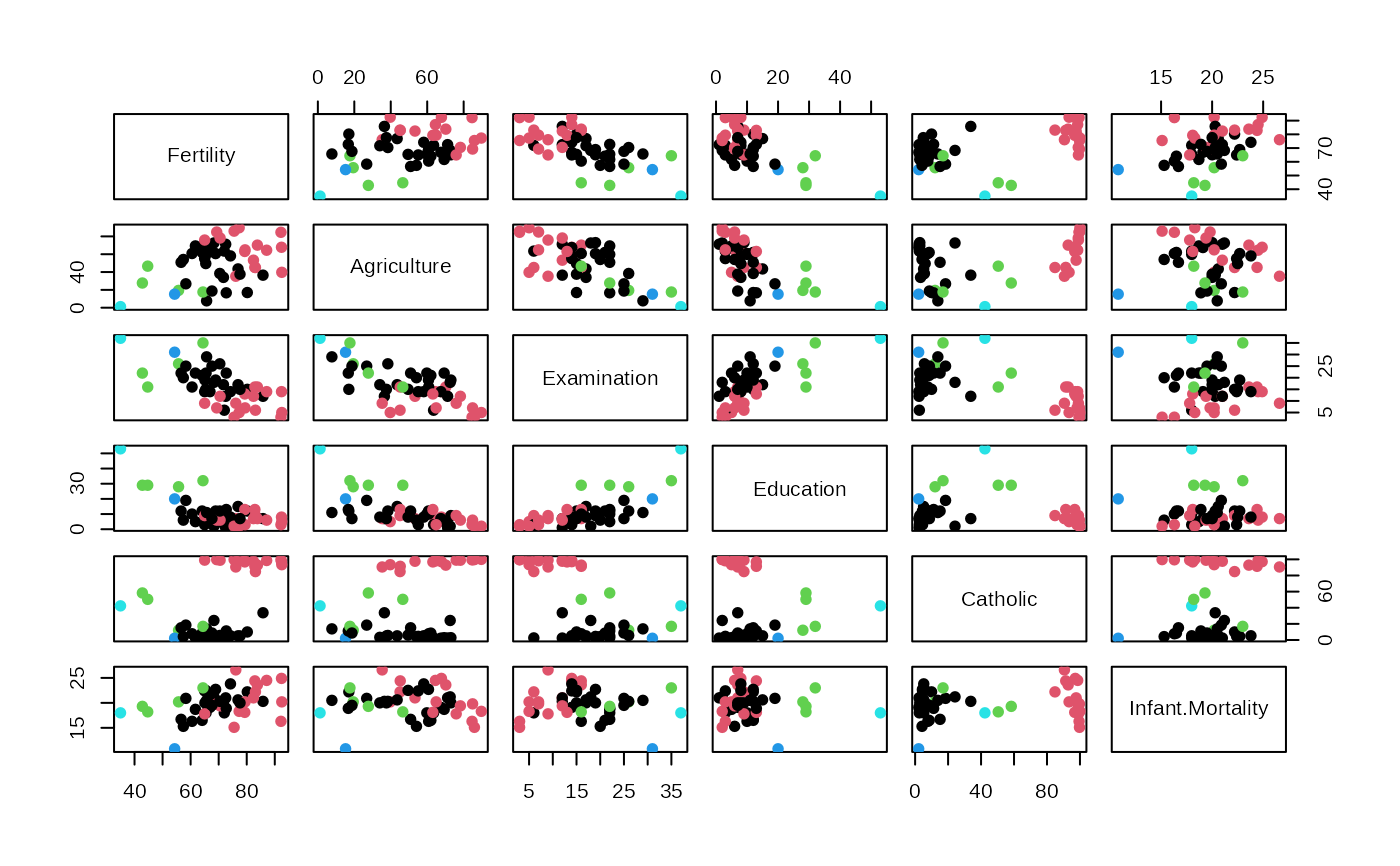
clusters <- wce(agreements)
plot(swiss, col = clusters, pch = 19)
# Define agreement as being close enough to each other.
# By defining low agreement as -1 and high agreement as +1, we
# solve *unweighted* cluster editing
agreements <- ifelse(as.matrix(distances) < 3, 1, -1)
clusters <- wce(agreements)
plot(swiss, col = clusters, pch = 19)
 # }
# }